Fig. 5
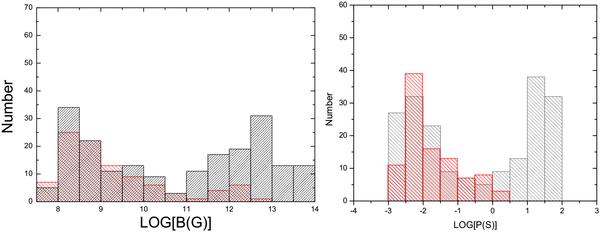
Plots of histograms for spin period and magnetic field obtained from calculations
of the theoretical model and for the observed binary pulsars (red-shaded). In
theoretical calculations, we assume that the initial B-field
follows a Gaussian distribution, centered at 5 × 10¹² G and ranging from
5 × 10¹⁰ G (e.g. Hartman et al. 1997) to 1014 G (e.g. Kaspi 2010). As for the initial spin period, it is assumed to be a Gaussian
distribution, centered at 30 s and ranging from 0.5 s to 100 s. The different
accretion rates are set from  to
to  .
The theoretically evolved B-field and spin period values occurred
in the left parts of the plots, which are similar to the observed distributions.
.
The theoretically evolved B-field and spin period values occurred
in the left parts of the plots, which are similar to the observed distributions.
Current usage metrics show cumulative count of Article Views (full-text article views including HTML views, PDF and ePub downloads, according to the available data) and Abstracts Views on Vision4Press platform.
Data correspond to usage on the plateform after 2015. The current usage metrics is available 48-96 hours after online publication and is updated daily on week days.
Initial download of the metrics may take a while.