Fig. 3
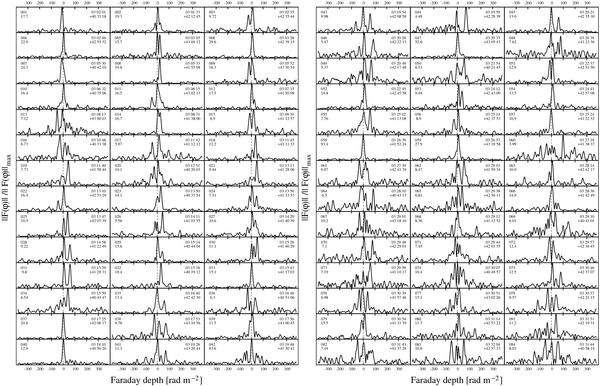
Faraday dispersion spectra of interesting lines of sight through the mosaic. The top left number is the label of the spectrum in Fig. 2. The vertical scale is different for each graph. The peak brightness in mJy beam-1 rmsf-1 is displayed below the number of the spectrum. The top right corner of each plot lists the J2000 α and δ.
Current usage metrics show cumulative count of Article Views (full-text article views including HTML views, PDF and ePub downloads, according to the available data) and Abstracts Views on Vision4Press platform.
Data correspond to usage on the plateform after 2015. The current usage metrics is available 48-96 hours after online publication and is updated daily on week days.
Initial download of the metrics may take a while.