Fig. 6
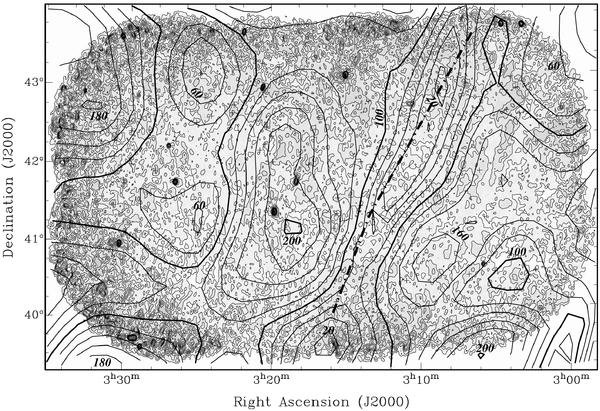
Wolleben et al. (2006) polarized intensity contours at 1.41 GHz overlaid on the integrated polarized intensity map of the RM-cube. The thin contours represent the polarized intensity at 351 MHz and are drawn at 4 to 40 K in steps of 4 K. The thick contours represent the Wolleben map and are drawn at 20 to 200 mK in steps of 20 mK. The dashed line represents the “front”.
Current usage metrics show cumulative count of Article Views (full-text article views including HTML views, PDF and ePub downloads, according to the available data) and Abstracts Views on Vision4Press platform.
Data correspond to usage on the plateform after 2015. The current usage metrics is available 48-96 hours after online publication and is updated daily on week days.
Initial download of the metrics may take a while.