Fig. 3
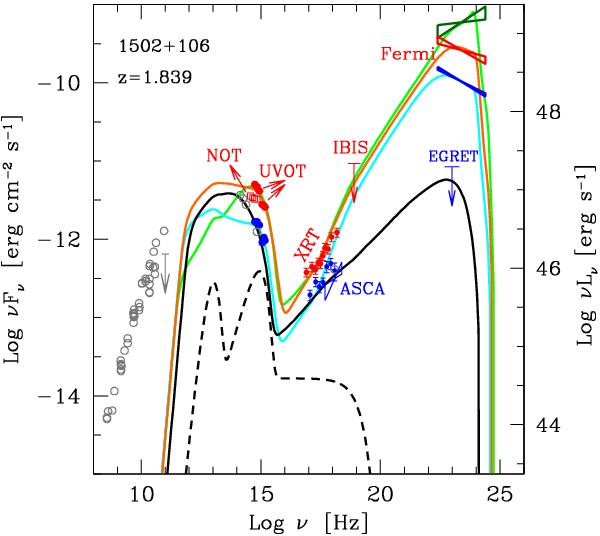
Spectral energy distributions of PKS 1502+106. The red circles and the darkgreen bowtie at GeV energies represent the data of the outburst state of 8 August 2008; the red bowtie represents the Fermi LAT outburst spectrum averaged over the days 5–10 August and the downward pointing arrow is the INTEGRAL IBIS/ISGRI upper limit of 9–11 August. The blue circles represent the post-flare state of 15–22 August 2008 (Swift XRT and UVOT) and the blue bowtie is the spectrum in the low gamma-ray state observed by Fermi during its first 3 months in orbit (Abdo et al. 2009), equivalent to the Fermi LAT post-flare state after 11 August 2008 (see Abdo et al. 2010b). The NOT data (red open squares) refer to 13 August 2008. The ASCA and CGRO EGRET data (blue) and the grey open circles represent a historical quiescent radio-to-gamma-ray state. The optical/UV data have been corrected for dust extinction in our Galaxy using EB − V = 0.032 (Schlegel et al. 1998) and the extinction curve of Cardelli et al. (1989). The optical magnitudes from NOT and the optical-UV magnitudes from UVOT have been converted to fluxes according to Fukugita et al. (1995) and to Poole et al. (2008), respectively. The errors include the statistical and systematic uncertainties. The solid curves represent the synchrotron plus synchrotron self-Compton and external Compton model we used to fit the data of the highest gamma-ray state (light green), average outburst gamma-ray state (orange), the low state (cyan) and the historical quiescent state (black). See text and Table 2 for the model parameters. The black dashed curve represents the thermal emission from the dust torus, the accretion disk and its corona. The models do not account for the radio emission, that is likely produced in larger regions than the homogeneous one where the high energy emission takes place.
Current usage metrics show cumulative count of Article Views (full-text article views including HTML views, PDF and ePub downloads, according to the available data) and Abstracts Views on Vision4Press platform.
Data correspond to usage on the plateform after 2015. The current usage metrics is available 48-96 hours after online publication and is updated daily on week days.
Initial download of the metrics may take a while.