Fig. 4
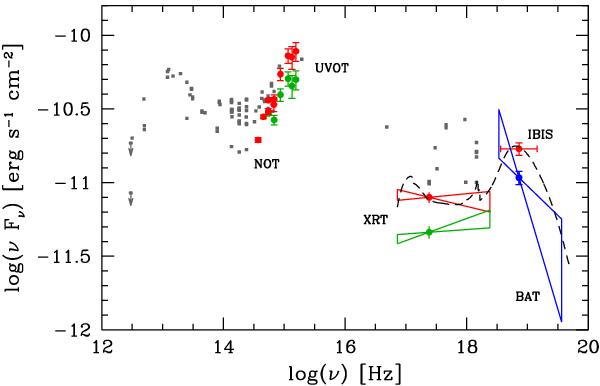
Spectral energy distributions of Mkn 841 in August 2008 (red symbols: INTEGRAL IBIS/ISGRI, 9–11 August; Swift XRT spectrum, 8 August; Swift UVOT, 13–15 August; NOT photometry, 13 August), on 3 February 2007 (green symbols: Swift XRT and UVOT) and at prior epochs, not from simultaneous data (taken from the NED Extragalactic Database, grey squares). The optical/UV data have been corrected for dust extinction in our Galaxy using EB − V = 0.03 (Schlegel et al. 1998) and the extinction curve of Cardelli et al. (1989). The optical magnitudes from NOT and the optical-UV magnitudes from UVOT have been converted to fluxes according to Fukugita et al. (1995) and to Poole et al. (2008), respectively. In addition, the Swift BAT spectrum from the first 39 months of the mission is shown in blue (December 2004–February 2008, Cusumano et al. 2010). The errors include the statistical and systematic uncertainties. The model fitted by Bianchi et al. (2001) to the 1999 BeppoSAX spectrum, including a soft X-ray excess, a Comptonized spectrum of a hot corona with a high energy cutoff and a reflected component, is shown as a dashed curve.
Current usage metrics show cumulative count of Article Views (full-text article views including HTML views, PDF and ePub downloads, according to the available data) and Abstracts Views on Vision4Press platform.
Data correspond to usage on the plateform after 2015. The current usage metrics is available 48-96 hours after online publication and is updated daily on week days.
Initial download of the metrics may take a while.