Fig. 3
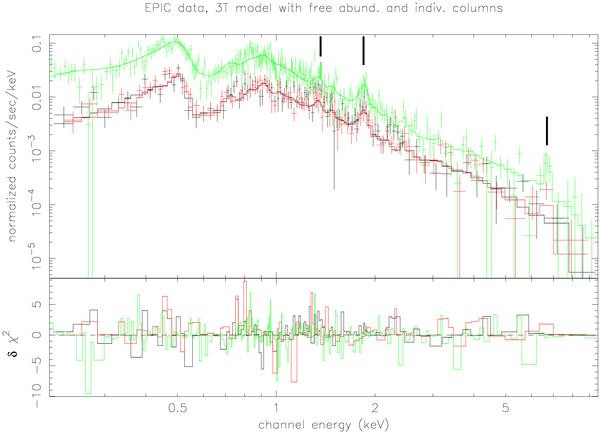
EPIC spectra of WR 46, along with the best-fit 3T model with HeCNO abundances let free and individual absorptions. The lower panel indicates the contribution of the individual data bins to the total χ2 of the fit. The individual contributions have been plotted with the sign of the deviation. The observations and the fitted model for the pn detector are given in green, MOS1 in black, and MOS2 in red (colour indications refer to the electronic version of the paper). The vertical marks represent the positions of the Mg xi − Mg xii lines around 1.4 keV, the Si xiii line at 1.85 keV, and the Fe-K line at 6.7 keV.
Current usage metrics show cumulative count of Article Views (full-text article views including HTML views, PDF and ePub downloads, according to the available data) and Abstracts Views on Vision4Press platform.
Data correspond to usage on the plateform after 2015. The current usage metrics is available 48-96 hours after online publication and is updated daily on week days.
Initial download of the metrics may take a while.