Fig. A.15
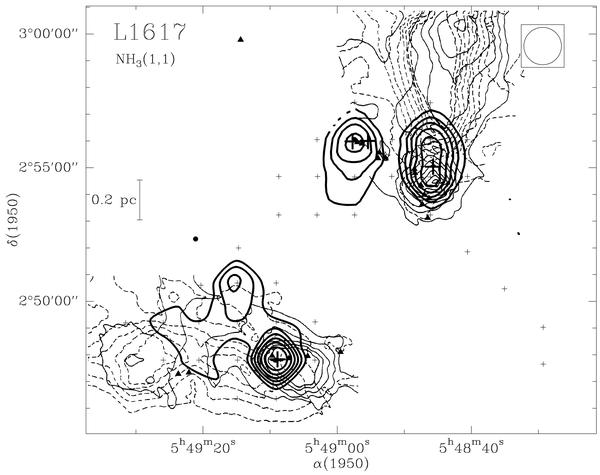
Ammonia cores in L1617 (thick contours) overlapped on the CO outflow maps of Reipurth & Olberg (1991) (thin contours). Symbols used in this map are same as Fig. A.1. Close-ups of the clumps of the NW region (associated with HH 270/110) and SE region (associated with HH 111) are shown in Fig. A.16 and Fig. A.17 respectively. Ammonia contour levels are the same as in these figures. Additional positions were observed near HH 113 (~12′ east from HH111).
Current usage metrics show cumulative count of Article Views (full-text article views including HTML views, PDF and ePub downloads, according to the available data) and Abstracts Views on Vision4Press platform.
Data correspond to usage on the plateform after 2015. The current usage metrics is available 48-96 hours after online publication and is updated daily on week days.
Initial download of the metrics may take a while.