Fig. A.22
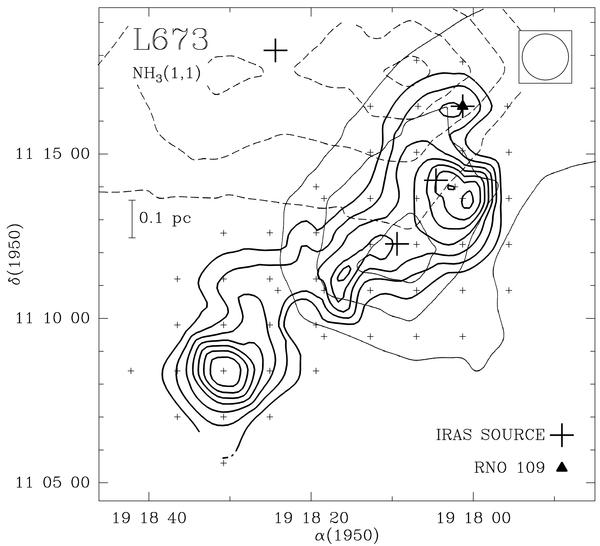
Same as Fig. A.1, but for the L673 region. The NH3 lowest contour level is 0.45 K and the increment is 0.3 K. The NH3 map obtained in previous observations is also included. The IRAS sources associated with the ammonia structure are (from north to south) IRAS 19180+1116(=RNO 109), IRAS 19180+1114 and IRAS 19184+1118. The map of the CO molecular outflow is from Armstrong & Winnewisser (1989).
Current usage metrics show cumulative count of Article Views (full-text article views including HTML views, PDF and ePub downloads, according to the available data) and Abstracts Views on Vision4Press platform.
Data correspond to usage on the plateform after 2015. The current usage metrics is available 48-96 hours after online publication and is updated daily on week days.
Initial download of the metrics may take a while.