Fig. 10
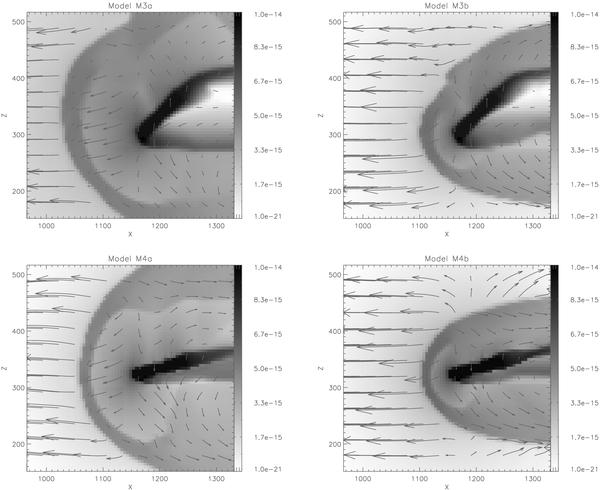
Density xz-midplane stratifications superimposed on velocity field vectors for models M3a (top-left), M3b (top-right), M4a (bottom-left) and M4b (bottom-right), at t = 2000 yr. The distance to the origin of the coordinate system, in AU, is depicted for the x and z axes. The right-hand side bars indicate the density scale (in g cm-3).
Current usage metrics show cumulative count of Article Views (full-text article views including HTML views, PDF and ePub downloads, according to the available data) and Abstracts Views on Vision4Press platform.
Data correspond to usage on the plateform after 2015. The current usage metrics is available 48-96 hours after online publication and is updated daily on week days.
Initial download of the metrics may take a while.