Fig. 1
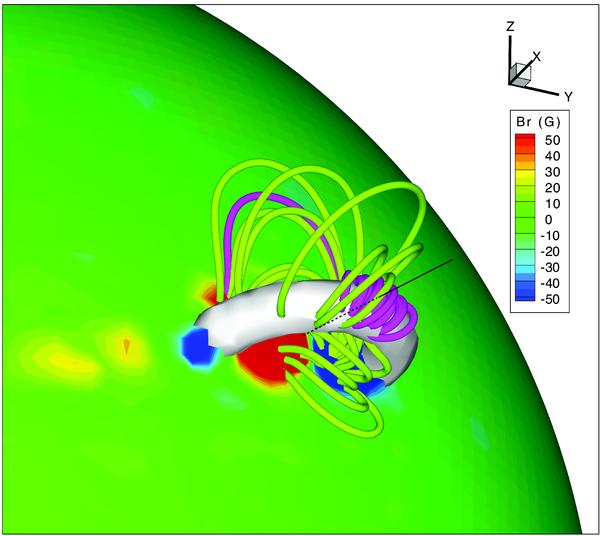
The inserted flux rope and the active region on the sun. The color on the spherical surface represents the magnetic field on the surface of the sun. The flux rope is represented by the isosurface of the current I = 200 mA. The pink lines are the magnetic field lines around the flux rope. The black line illustrates the line around which the grids are refined and the density, temperature, and magnetic field are also sampled for detailed investigation.
Current usage metrics show cumulative count of Article Views (full-text article views including HTML views, PDF and ePub downloads, according to the available data) and Abstracts Views on Vision4Press platform.
Data correspond to usage on the plateform after 2015. The current usage metrics is available 48-96 hours after online publication and is updated daily on week days.
Initial download of the metrics may take a while.