Fig. 3
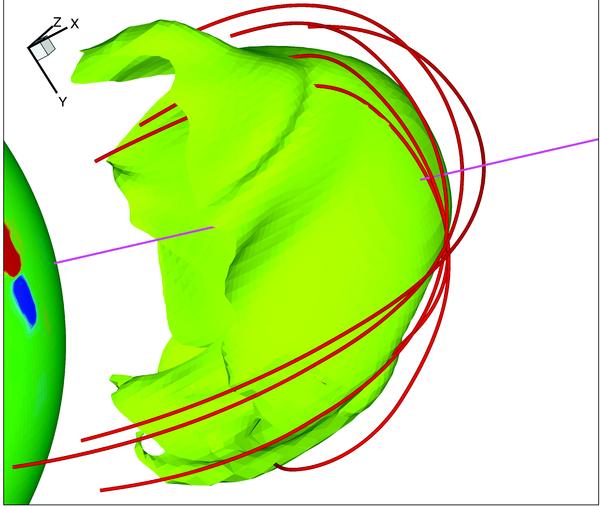
The magnetic field lines drape around flux rope. The green surface is an isosurface of density 10-17 g/cm-3, which represents the flux rope. The red lines are the magnetic field lines. The colored sphere on the left represents part of the Sun′s surface. The blue and red area is the active region where we inserted a flux rope to initiate a CME. The pink line indicates the line from which we sampled the data.
Current usage metrics show cumulative count of Article Views (full-text article views including HTML views, PDF and ePub downloads, according to the available data) and Abstracts Views on Vision4Press platform.
Data correspond to usage on the plateform after 2015. The current usage metrics is available 48-96 hours after online publication and is updated daily on week days.
Initial download of the metrics may take a while.