Free Access
Fig. 6
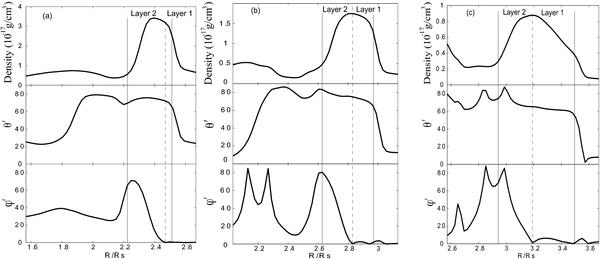
The plot of density and the rotation angles θ′, φ′, for a) t = 20, b) t = 30, and c) t = 40 min. The dashed lines mark the layer close to the flux rope in which all the transitions happen. The magnetic field lines rotate to drape around the flux rope in this region.
This figure is made of several images, please see below:
Current usage metrics show cumulative count of Article Views (full-text article views including HTML views, PDF and ePub downloads, according to the available data) and Abstracts Views on Vision4Press platform.
Data correspond to usage on the plateform after 2015. The current usage metrics is available 48-96 hours after online publication and is updated daily on week days.
Initial download of the metrics may take a while.