Fig. 7
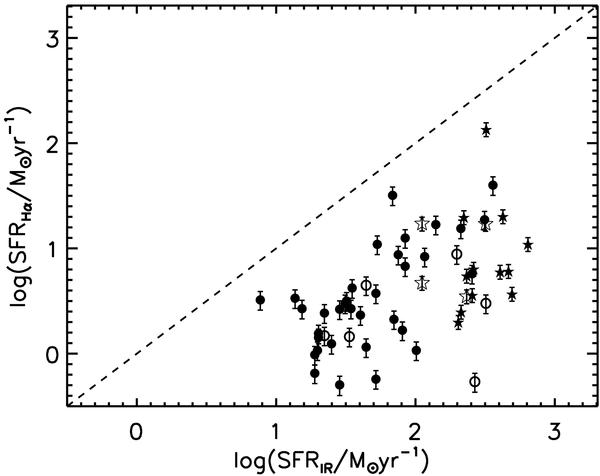
Log of the star-formation rates (SFR) in M⊙ yr-1 derived using the the Hα luminosity (SFRHα), without reddening correction, plotted against the log of the SFR obtained using the IR luminosities. We used the results of García-Marín et al. (2009a) for the figure from their sample of ULIRGs. The circles correspond to the objects in our sample, while stars correspond to objects in García-Marín et al. (2009a) sample. Those objects classified as Sy galaxies are indicated in the figure with open symbols.
Current usage metrics show cumulative count of Article Views (full-text article views including HTML views, PDF and ePub downloads, according to the available data) and Abstracts Views on Vision4Press platform.
Data correspond to usage on the plateform after 2015. The current usage metrics is available 48-96 hours after online publication and is updated daily on week days.
Initial download of the metrics may take a while.