Fig. 1
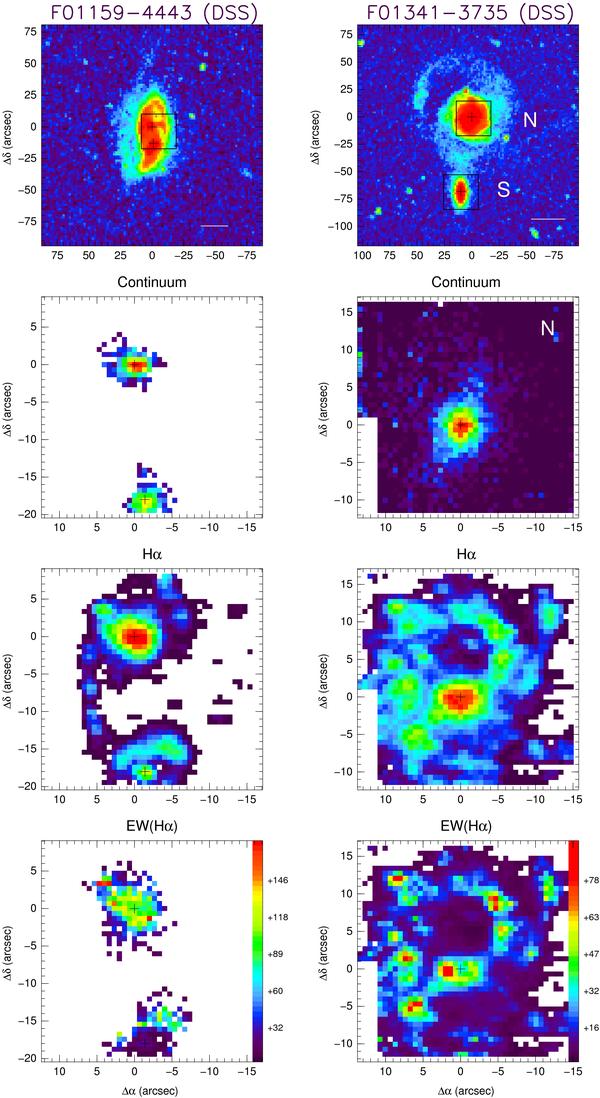
Top panel: DSS image of the galaxy. For those objects for which HST images are available in the literature these are used for the figure. The exceptions are IRAS F13229-2934 and IRAS F21453-3511. For these galaxies the HST image does not cover the entire emission from the galaxies and we prefered to use the DSS images. The box on the DSS or HST images indicates the VIMOS field of view, while the horizontal line in the bottom left of the same images corresponds to a scale of 10 kpc. Second panel: the continuum within the wavelength range 6390–6490 Å (rest frame). Third panel: the Hα emission from the galaxy. Both the continuum and the Hα maps are represented in logarithmic scale, and in arbitrary flux units. Fourth panel: Hα equivalent width (Hα − EW) in Å. With the exception of IRAS F10567-4310 and IRAS F17138-1017, the peak of the continuum emission, identified as the nucleus of the galaxy, is indicated in all the maps with a “plus” sign. For these two galaxies the morphology of the continuum is less constrained because of the presence of vertical patterns (see text for details). In these cases the “plus” sign corresponds to the location of the peak of the Hα emission. Note that two pointings were used to cover the full emission from the galaxy IRAS F09437+0317N (IC 564), which are referred to in the figure as N(P1) and N(P2).
Current usage metrics show cumulative count of Article Views (full-text article views including HTML views, PDF and ePub downloads, according to the available data) and Abstracts Views on Vision4Press platform.
Data correspond to usage on the plateform after 2015. The current usage metrics is available 48-96 hours after online publication and is updated daily on week days.
Initial download of the metrics may take a while.