Fig. 1
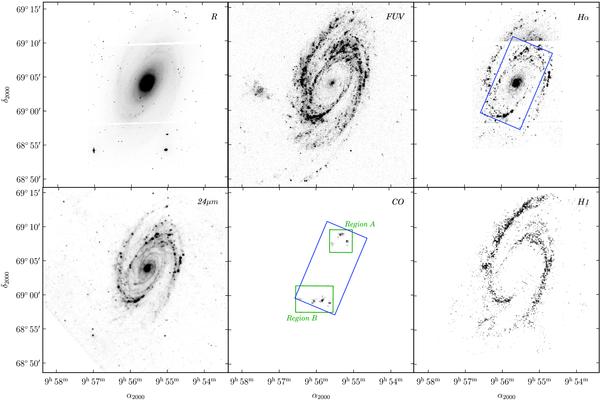
Panels showing, at the same scale, our new CO J = 3−2, R-band, and continuum-subtracted Hα maps together with ancillary data introduced in Sect. 2.3. All the maps are displayed at their original resolution. The cut levels have been arbitrarily set to enhance the main features at each wavelength. The blue solid rectangle represents the CO J = 3−2 region mapped. For comparison purposes, the same area is also overlaid on the Hα map. The regions where the CO emission is not reliable (see Sect. 2) are not shown. Green lines delimit the areas covered by the regions displayed in Figs. 3 and 4, where all our CO detections are located. The white spaces shown in the Hα map are due to the separation between the chips in the CCD array.
Current usage metrics show cumulative count of Article Views (full-text article views including HTML views, PDF and ePub downloads, according to the available data) and Abstracts Views on Vision4Press platform.
Data correspond to usage on the plateform after 2015. The current usage metrics is available 48-96 hours after online publication and is updated daily on week days.
Initial download of the metrics may take a while.