Free Access
Fig. 11
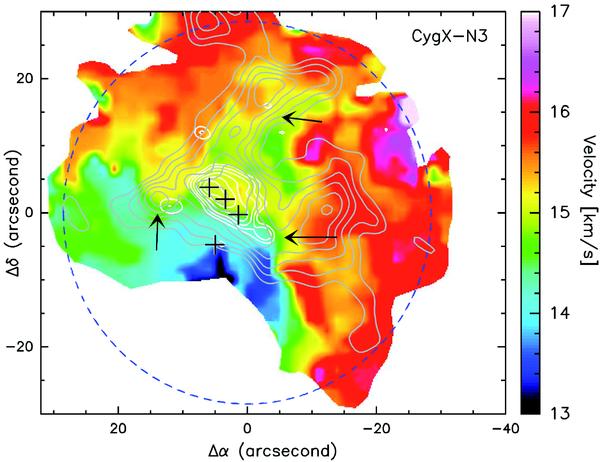
The velocity field obtained from IRAM 30 m+PdBI H13CO+ data (in the same way as for Fig. 5b towards CygX-N3 is shown with overlays of integrated intensity (contour levels are from 20σ to 50σ in steps of 5σ. White contours show the 3 mm continuum emission. Arrows indicate the shears associated with weak continuum emission.
Current usage metrics show cumulative count of Article Views (full-text article views including HTML views, PDF and ePub downloads, according to the available data) and Abstracts Views on Vision4Press platform.
Data correspond to usage on the plateform after 2015. The current usage metrics is available 48-96 hours after online publication and is updated daily on week days.
Initial download of the metrics may take a while.