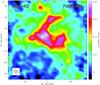
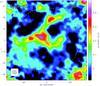
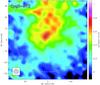
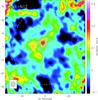
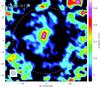
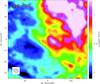
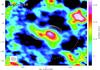
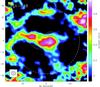
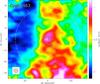
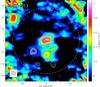
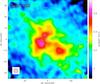
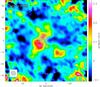
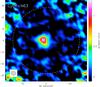
Fig. 4
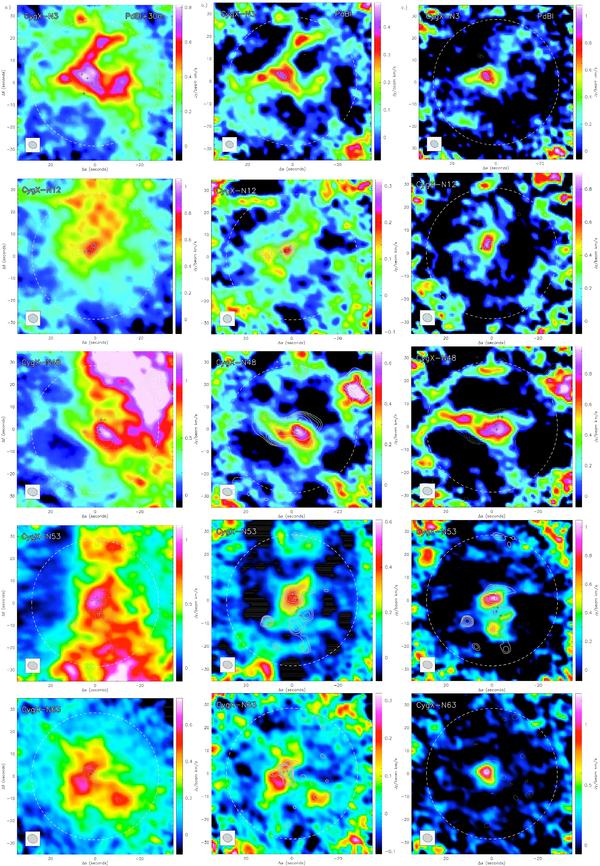
a) Integrated intensity maps of H13CO+ (J = 1–0) obtained with PdBI and combined with observations from the IRAM 30 m telescope (the scaling goes from −2σ to 35σ for field N63 and N12, and from − 2σ to 60σ for all other fields). Contours show the 3 mm continuum emission, where levels are the same as in Paper I. Crosses indicate the location of 1 mm continuum sources reported in Paper I. Dashed circles indicate the primary beam of the PdBI. Gray ellipses in the left lower corner show the synthesized beam. b) Interferometric line-integrated intensity maps of H13CO+ (J = 1–0). c) Integrated line intensity maps of H13CN (J = 1–0) (over all hyperfine components).
Current usage metrics show cumulative count of Article Views (full-text article views including HTML views, PDF and ePub downloads, according to the available data) and Abstracts Views on Vision4Press platform.
Data correspond to usage on the plateform after 2015. The current usage metrics is available 48-96 hours after online publication and is updated daily on week days.
Initial download of the metrics may take a while.