Fig. 7
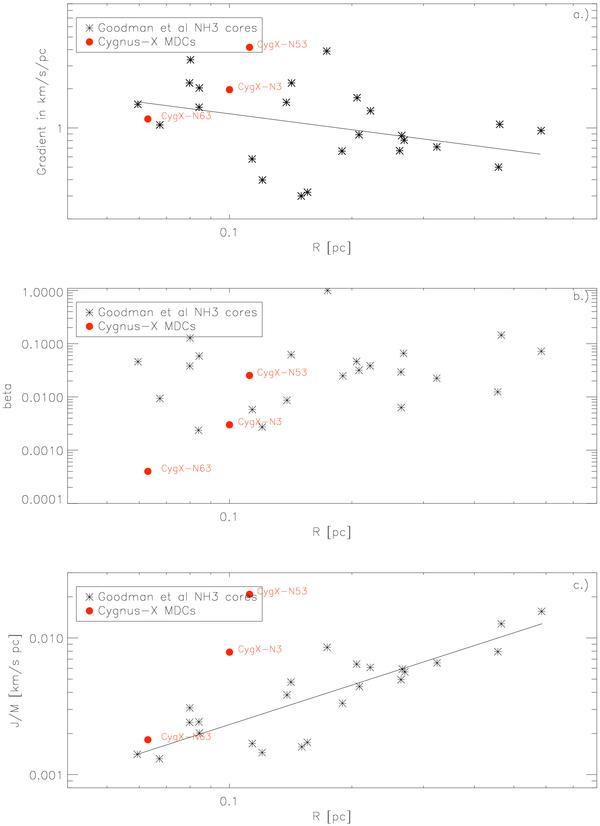
a) Plot of size versus velocity gradient comparing a sample of low-mass cores (Goodman et al. 1993) with the Cygnus-X MDC sample using single-dish data. Red symbols represent the Cygnus-X MDCs, while black stars show the sample of Goodman et al. (1993). Black line shows the best-fit relation of Goodman et al. (1993) with G = 10 − 0.3 ± 0.2R − 0.4 ± 0.2. b) Plot of β versus size relation shown for the same sample. c) Plot of the specific angular momentum versus size. Black line shows the best-fit line from Goodman et al. (1993) with J/M = 10 .
.
Current usage metrics show cumulative count of Article Views (full-text article views including HTML views, PDF and ePub downloads, according to the available data) and Abstracts Views on Vision4Press platform.
Data correspond to usage on the plateform after 2015. The current usage metrics is available 48-96 hours after online publication and is updated daily on week days.
Initial download of the metrics may take a while.