Fig. 3
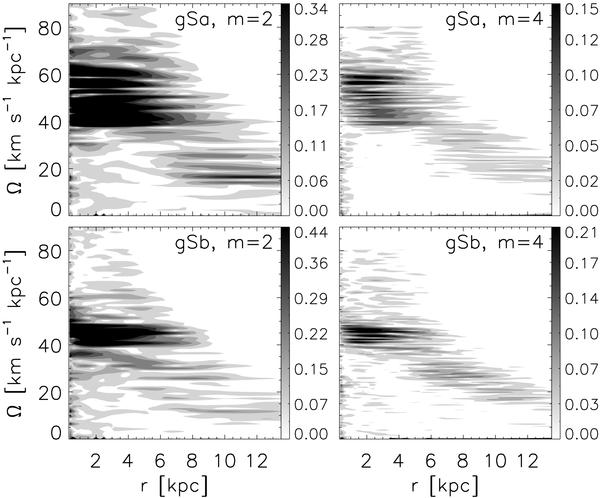
Power spectrum displaying the pattern speed of the m = 2 and m = 4 Fourier components, during the entire simulation, of the gSa (top) and gSb (bottom) models. Contour levels are indicated for each panel. Note that the gSa bar evolves (slows down and extends) much more and its two-armed SS is twice as strong as for the gSb model (top left). Despite the slightly stronger gSb bar, the effect on ΔL in the gSa’s outer disk is much more prominent (Fig. 2) because of the combined effect of the bar and stronger spirals.
Current usage metrics show cumulative count of Article Views (full-text article views including HTML views, PDF and ePub downloads, according to the available data) and Abstracts Views on Vision4Press platform.
Data correspond to usage on the plateform after 2015. The current usage metrics is available 48-96 hours after online publication and is updated daily on week days.
Initial download of the metrics may take a while.