Fig. 13
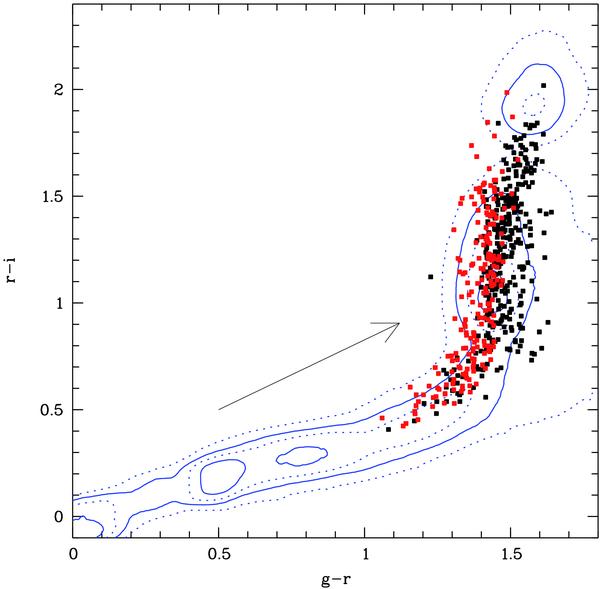
Distribution of X-ray active stars in the g − r / r − i diagram for two ranges of X-ray luminosities. Black dots Log(Lx) < 29.3. Red crosses Log(Lx) > 29.3. The arrow shows the direction of interstellar reddening. Only sources with photometric errors below 0.1 mag in g − r and r − i are shown. Density contours show the position of all stars identified in the SEGUE programme.
Current usage metrics show cumulative count of Article Views (full-text article views including HTML views, PDF and ePub downloads, according to the available data) and Abstracts Views on Vision4Press platform.
Data correspond to usage on the plateform after 2015. The current usage metrics is available 48-96 hours after online publication and is updated daily on week days.
Initial download of the metrics may take a while.