Fig. 3
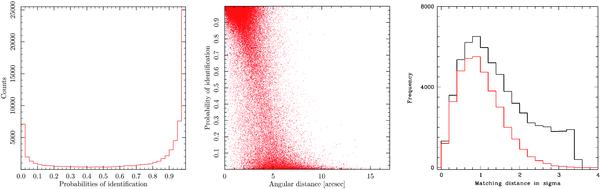
Left: histogram of the individual probabilities of identification. Centre: probabilities of identification versus matching distances. Right: distribution of the distance of SDSS candidates to 2XMMi sources expressed in units of the combined 2XMMi + SDSS positional error; black = all matches, red = identification probabilities ≥ 90%.
Current usage metrics show cumulative count of Article Views (full-text article views including HTML views, PDF and ePub downloads, according to the available data) and Abstracts Views on Vision4Press platform.
Data correspond to usage on the plateform after 2015. The current usage metrics is available 48-96 hours after online publication and is updated daily on week days.
Initial download of the metrics may take a while.