Fig. 4
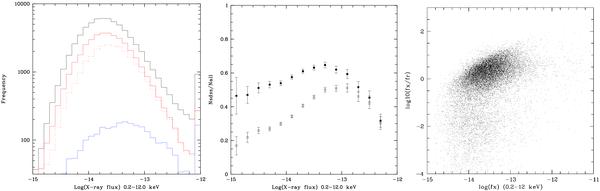
Left panel: X-ray flux distribution. From top to bottom, black line: all X-ray sources found in 2XMMi fields overlapping SDSS DR7, red line: all X-ray sources matching a SDSS entry, red dashed line: 2XMMi/SDSS R7 correlations with individual identification probabilities >90%, blue line: “final” identified sample. Centre panel: ratio of the SDSS identified to total number of 2XMMi sources. Upper curve, filled squares; all matches, lower curve, empty squares, matches with identification probabilities ≥90%. Right panel: variation of log(fx/fr) with X-ray flux for 2XMMi/SDSS DR7 sources with identification probabilities ≥ 90% and r magnitude brighter than 22.2. In all cases, the combined unique EPIC source detection likelihood is ≥ 6.
Current usage metrics show cumulative count of Article Views (full-text article views including HTML views, PDF and ePub downloads, according to the available data) and Abstracts Views on Vision4Press platform.
Data correspond to usage on the plateform after 2015. The current usage metrics is available 48-96 hours after online publication and is updated daily on week days.
Initial download of the metrics may take a while.