Fig. 5
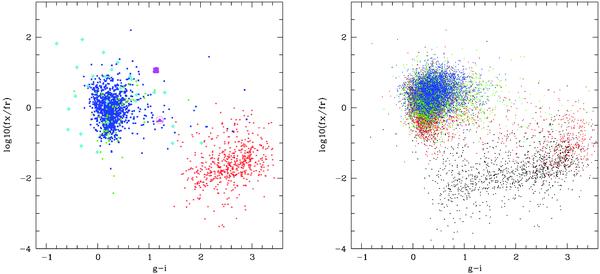
Distribution of spatially unresolved objects in the optical band in the log(fx/fr) versus g − i diagram. Left: the identified sample. Blue: AGNs with log(LX) ≥ 44, green: 44 ≥ log (LX) ≥ 42, magenta: QSO2s – filled squares = X-ray selected – filled triangles = optically selected – encircled = Compton Thick (see Sect. 8.1), red: stars, cyan: accreting binaries. Right: the entire SDSS photometric sample. In this case, the colour codes the range of r magnitude. black: < 18, red: 18–20, green, 20–21, blue: > 21. We only show SDSS entries with a probability of identification with an X-ray source higher than 90%, g and i magnitudes brighter than 22.2 and errors on g − i < 0.2.
Current usage metrics show cumulative count of Article Views (full-text article views including HTML views, PDF and ePub downloads, according to the available data) and Abstracts Views on Vision4Press platform.
Data correspond to usage on the plateform after 2015. The current usage metrics is available 48-96 hours after online publication and is updated daily on week days.
Initial download of the metrics may take a while.