Fig. 7
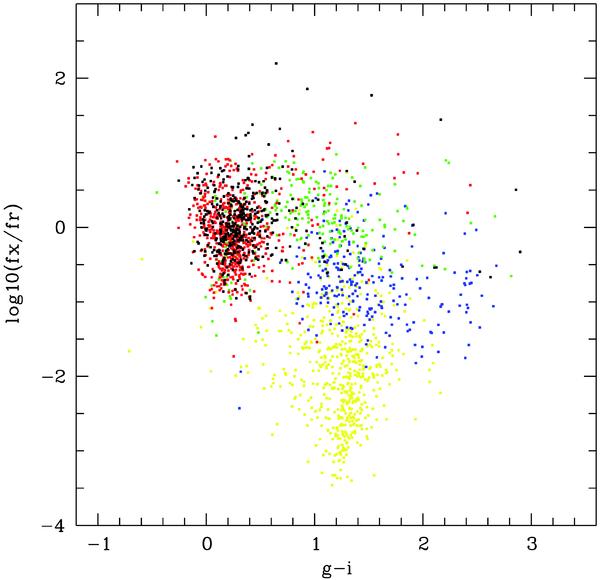
Distribution of extragalactic objects in the log (fx/fr) versus g − i diagram according to LX. Black; > 1045, red 1044 to 1045, green 1043 to 1044, blue 1042 to 1043, yellow 1038 to 1042. We only show SDSS entries with a probability of identification with an X-ray source higher than 90%, g and i magnitudes brighter than 22.2 and errors on g − i < 0.2.
Current usage metrics show cumulative count of Article Views (full-text article views including HTML views, PDF and ePub downloads, according to the available data) and Abstracts Views on Vision4Press platform.
Data correspond to usage on the plateform after 2015. The current usage metrics is available 48-96 hours after online publication and is updated daily on week days.
Initial download of the metrics may take a while.