Fig. 13
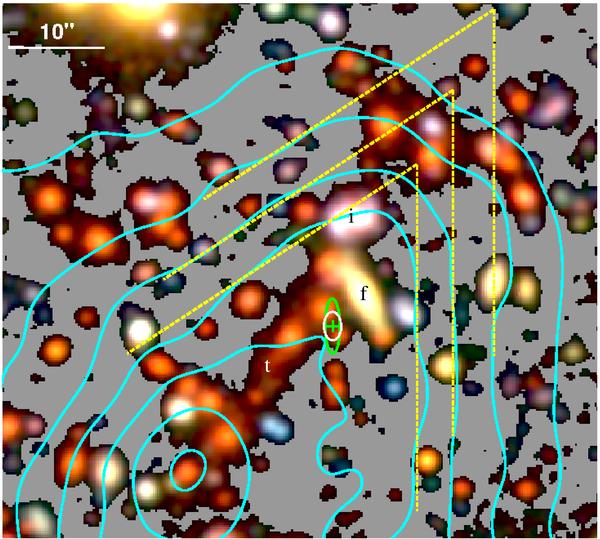
Zoom on the dynamically active North-Western core region of the cluster. The 62″ × 55″ LBT/LBC optical color composite displays the Northern part of core component (I) and a full view on region (II) identified in Fig. 10. The Chandra X-ray surface brightness contours (cyan) exhibit a pronounced cone-like structure with an approximate opening angle of 56deg (yellow lines). Marginally extended 1.4 GHz radio emission is detected along the approximate symmetry axis of the configuration, displayed by the green cross for the location, the white spatial error ellipse, and the green ellipse indicating the observed source shape and extent. Character labels refer to candidate events of tidal stripping (t), galaxy-galaxy interaction (i), and a foreground galaxy (f). To enhance the contrast of low surface brightness features in the optical image, a smoothing with a 0.7″ Gaussian kernel was applied to the data, and the black background was remapped to gray scale.
Current usage metrics show cumulative count of Article Views (full-text article views including HTML views, PDF and ePub downloads, according to the available data) and Abstracts Views on Vision4Press platform.
Data correspond to usage on the plateform after 2015. The current usage metrics is available 48-96 hours after online publication and is updated daily on week days.
Initial download of the metrics may take a while.