Fig. 2
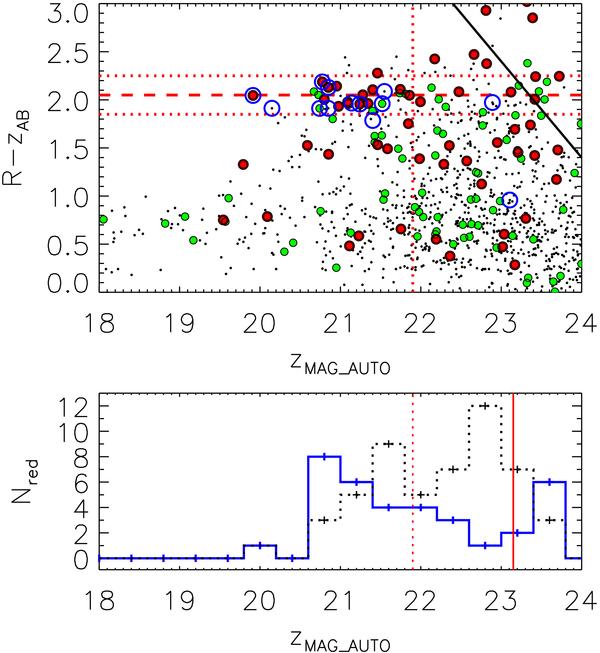
Top: R − z color–magnitude diagram of the cluster environment based on the FORS 2 imaging data. The richly populated cluster red-sequence around the median ridgeline color R − z ~ 2.05 (red dashed line) is clearly visible. Filled red circles indicate objects within a 30″ radius from the X-ray center, green circles correspond to 0.5−1′, small black dots represent all other objects in the field, and open circles mark spectroscopically confirmed cluster members. Horizontal dotted lines define the applied color cut interval of ± 0.2 mag about the median color, while the dotted vertical line refers to the expected apparent magnitude (m∗ ≃ 21.9 mag) of a passively evolving L∗ galaxy at the cluster redshift (in both panels). The 50% completeness limit is indicated by the black solid line. Bottom: histogram of galaxy counts in the red color interval 1.85 ≤ R − z ≤ 2.25 in bins of 0.4 mag for galaxies within 1′ from the cluster center (blue line). The vertical solid line indicates the nominal 50% completeness limit of the data, while the black dotted line shows the magnitude distribution for galaxies at larger distances for comparison.
Current usage metrics show cumulative count of Article Views (full-text article views including HTML views, PDF and ePub downloads, according to the available data) and Abstracts Views on Vision4Press platform.
Data correspond to usage on the plateform after 2015. The current usage metrics is available 48-96 hours after online publication and is updated daily on week days.
Initial download of the metrics may take a while.