Fig. 3
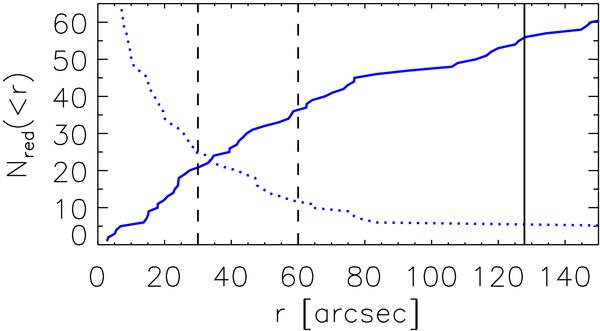
Cumulative radial distribution of color selected red galaxies (as in Fig. 2) as a function of cluster-centric distance (blue solid line). Dashed vertical lines indicate the radii used for color coded symbols in Fig. 2, the solid line marks the fiducial cluster radius. The dotted blue line shows the cumulative radial red galaxy number counts normalized to the enclosed area, i.e. the average red galaxy density per square arcminute within the cluster-centric distance r.
Current usage metrics show cumulative count of Article Views (full-text article views including HTML views, PDF and ePub downloads, according to the available data) and Abstracts Views on Vision4Press platform.
Data correspond to usage on the plateform after 2015. The current usage metrics is available 48-96 hours after online publication and is updated daily on week days.
Initial download of the metrics may take a while.