Fig. 6
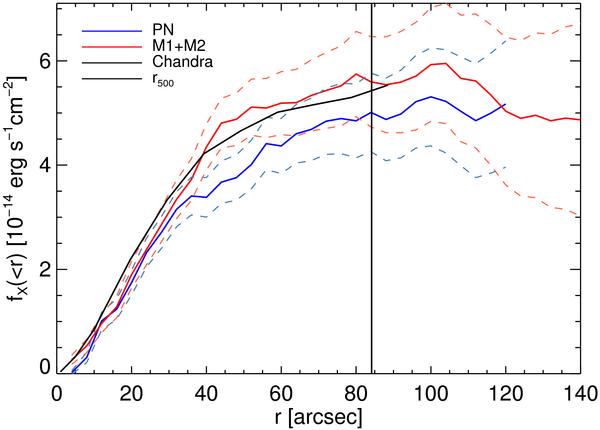
Growth curve analysis for the unabsorbed, background subtracted 0.5 − 2 keV X-ray flux as a function of projected cluster radius. The blue solid line shows the total 0.5 − 2 keV flux inside the projected radius r as measured with the XMM-Newton PN camera, the red line represents the sum of the two MOS instruments. Poisson errors plus 5% uncertainties in the background determination are displayed by the dashed lines, the vertical line depicts the R500 radius. The fully consistent Chandra GCA result is overplotted in black. The X-ray emission can be traced out to about 90″, where it reaches the plateau value.
Current usage metrics show cumulative count of Article Views (full-text article views including HTML views, PDF and ePub downloads, according to the available data) and Abstracts Views on Vision4Press platform.
Data correspond to usage on the plateform after 2015. The current usage metrics is available 48-96 hours after online publication and is updated daily on week days.
Initial download of the metrics may take a while.