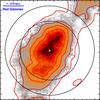
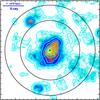
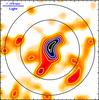
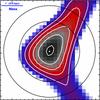
Fig. 9
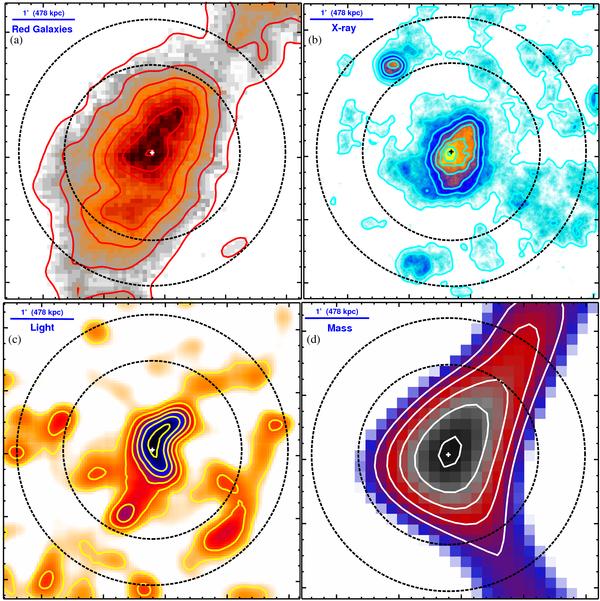
A pan-chromatic view of XMMU J1230.3+1339 seen through projected surface density maps of different physical quantities within the cluster’s R200 region (outer dashed circle). All panels show the same 4.8′ × 4.8′ sky region in standard orientation (North is up, East to left), the nominal cluster center (central cross) and R500 (inner dashed circle) are also indicated. Top left a): density map of color-selected red galaxies (log-spaced contours). Top right b): Chandra X-ray surface brightness map (log-spaced contours). Bottom left c): total z′-band light distribution map (linearly-spaced contours). Bottom right d): weak lensing mass density map (linearly-spaced contours).
Current usage metrics show cumulative count of Article Views (full-text article views including HTML views, PDF and ePub downloads, according to the available data) and Abstracts Views on Vision4Press platform.
Data correspond to usage on the plateform after 2015. The current usage metrics is available 48-96 hours after online publication and is updated daily on week days.
Initial download of the metrics may take a while.