Free Access
Fig. 6
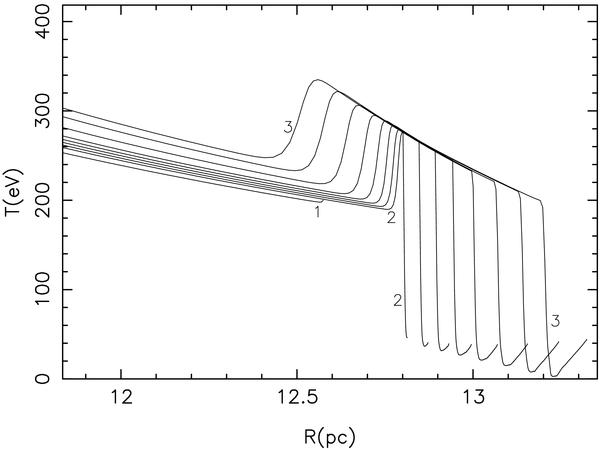
The radial temperature distribution (T in eV) in the revised model at different times before and after hitting the cavity wall. Labels 1 to 3 refer to the specific times: (1) −670 yr, (2) +120 yr, (3) +3300 yr.
Current usage metrics show cumulative count of Article Views (full-text article views including HTML views, PDF and ePub downloads, according to the available data) and Abstracts Views on Vision4Press platform.
Data correspond to usage on the plateform after 2015. The current usage metrics is available 48-96 hours after online publication and is updated daily on week days.
Initial download of the metrics may take a while.