Fig. 1
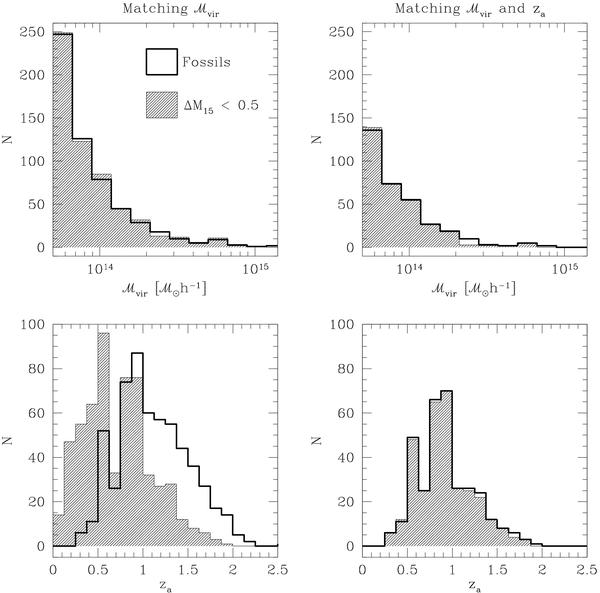
Upper panels show the virial mass distributions of the samples of fossil (empty) and ΔM12 < 0.5 mag (filled) groups in the MS, while lower panels show the assembly time distributions. Left panels: “Mass-matched” samples. Non-fossils that were selected to reproduce the same virial mass distribution of fossil groups in order to avoid a mass bias. Right panels: “Assembly-matched” samples. Fossils and non-fossils were selected to have both similar virial mass and assembly time distributions.
Current usage metrics show cumulative count of Article Views (full-text article views including HTML views, PDF and ePub downloads, according to the available data) and Abstracts Views on Vision4Press platform.
Data correspond to usage on the plateform after 2015. The current usage metrics is available 48-96 hours after online publication and is updated daily on week days.
Initial download of the metrics may take a while.