Fig. 2
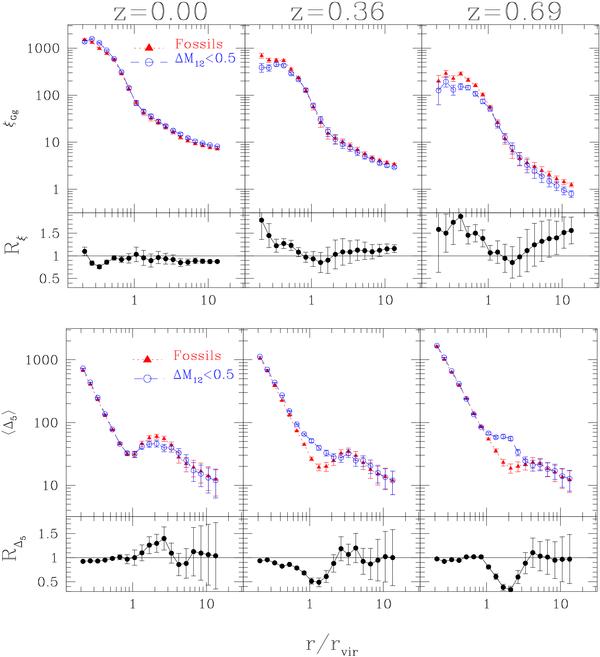
Top panels: group-galaxy cross-correlation functions of the mass-matched samples (ξG − gal). Upper panels: ξG − gal in the MS as a function of the normalised group-centric distance. Filled triangles (dotted lines) correspond to fossil groups, while open circles (dashed lines) correspond to normal groups with a magnitude gap ΔM12 smaller than 0.5 mag. Error bars are computed using an analytic formula for the Poisson error in the clustering signal (Peacock 1999). Lower panels: ratios of cross-correlation functions (Rξ) for fossils and groups with ΔM12 < 0.5 mag. Error bars are computed using the usual formula of error propagation. Panels from left to right: different stages of the group evolution (see upper labels). Bottom panels: local over-density profile of galaxies around groups (Δ5). Upper panels: Δ5 in the MS as a function of the normalised group-centric distance. Filled triangles (dotted lines) correspond to galaxies around fossils groups, while open circles (dashed lines) correspond to galaxies around normal groups with ΔM12 < 0.5 mag. Error bars represent the 35th and the 65th percentiles in the local density distribution at each distance bin. Lower panels: Ratios of local density profiles (RΔ5) of fossils and groups with ΔM12 < 0.5 mag. Error bars are computed using the usual formula of error propagation. Panels from left to right correspond to the stages of the group evolution (see upper labels).
Current usage metrics show cumulative count of Article Views (full-text article views including HTML views, PDF and ePub downloads, according to the available data) and Abstracts Views on Vision4Press platform.
Data correspond to usage on the plateform after 2015. The current usage metrics is available 48-96 hours after online publication and is updated daily on week days.
Initial download of the metrics may take a while.