Fig. 4
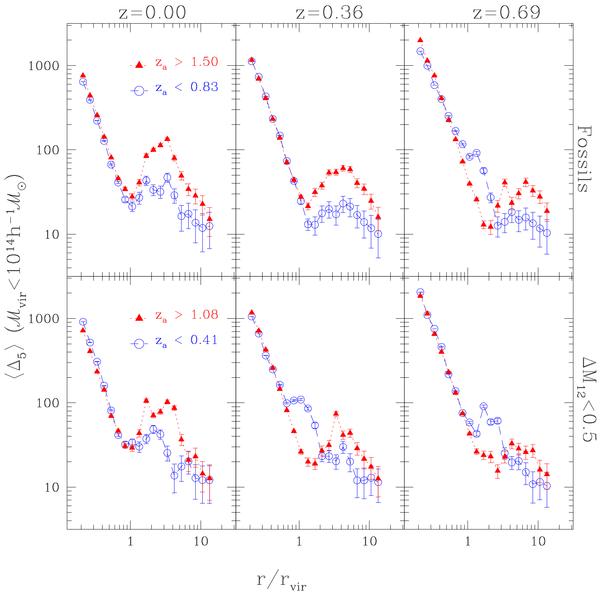
Local over-density profile of galaxies around fossil (upper panel) and non-fossil (lower panel) groups in the MS as a function of the normalised group-centric distance. Filled triangles correspond to the sub-sample of systems with early assembly times, while open circles correspond to a sub-sample with later assembly times. Error bars are the 35th and the 65th percentiles of the local density distribution at each distance bin.
Current usage metrics show cumulative count of Article Views (full-text article views including HTML views, PDF and ePub downloads, according to the available data) and Abstracts Views on Vision4Press platform.
Data correspond to usage on the plateform after 2015. The current usage metrics is available 48-96 hours after online publication and is updated daily on week days.
Initial download of the metrics may take a while.