Fig. 1
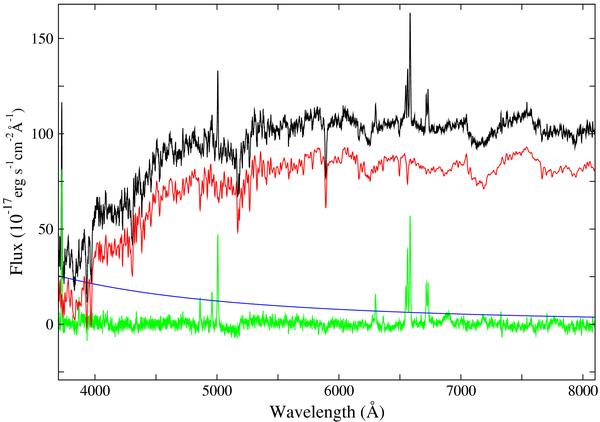
STARLIGHT fit for the spectrum of the X-shaped source J1424+2637. The plot shows the observed spectrum (top black line), the modeled spectrum (second red line, displaced from observed spectrum), the AGN continuum (blue line), and the residual spectrum (bottom green line). Note that the residual spectrum contains narrow and (in some objects) broad emission lines. Properties of these lines are measured separately (see Sect. 3.2).
Current usage metrics show cumulative count of Article Views (full-text article views including HTML views, PDF and ePub downloads, according to the available data) and Abstracts Views on Vision4Press platform.
Data correspond to usage on the plateform after 2015. The current usage metrics is available 48-96 hours after online publication and is updated daily on week days.
Initial download of the metrics may take a while.