Fig. 3
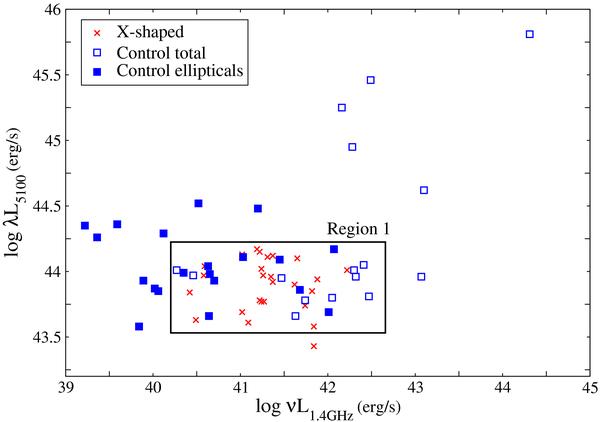
Optical continuum luminosity versus radio luminosity at 1.4 GHz for X-shaped (crosses) and control sources (squares). A small sub-region (“Region 1” marked by a rectangle inside the plot) is identified to provide a tighter luminosity match between the two samples. In the further analysis, Region 1 is also subdivided into two equal bins in the radio luminosity to assess a possible luminosity dependence of the black hole mass estimates.
Current usage metrics show cumulative count of Article Views (full-text article views including HTML views, PDF and ePub downloads, according to the available data) and Abstracts Views on Vision4Press platform.
Data correspond to usage on the plateform after 2015. The current usage metrics is available 48-96 hours after online publication and is updated daily on week days.
Initial download of the metrics may take a while.