Free Access
Fig. 4
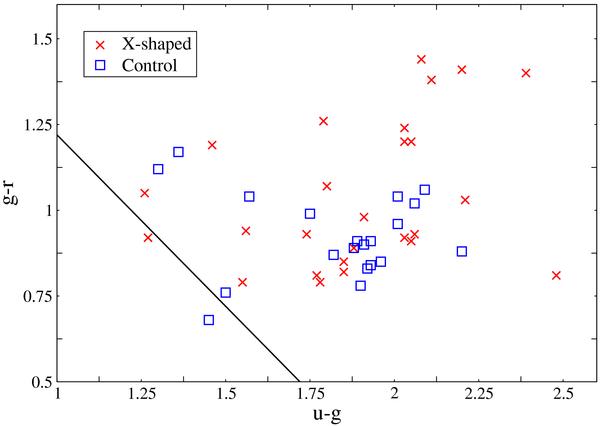
Color–color diagram (g-r colors versus u-g colors) for X-shaped sources (cross) and control sample (square). Black line: u − r = 2.22 galaxy type separator from Strateva et al. (2001). Sources situated above the line are classified as ellipticals.
Current usage metrics show cumulative count of Article Views (full-text article views including HTML views, PDF and ePub downloads, according to the available data) and Abstracts Views on Vision4Press platform.
Data correspond to usage on the plateform after 2015. The current usage metrics is available 48-96 hours after online publication and is updated daily on week days.
Initial download of the metrics may take a while.