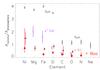
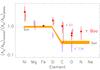
Fig. 6
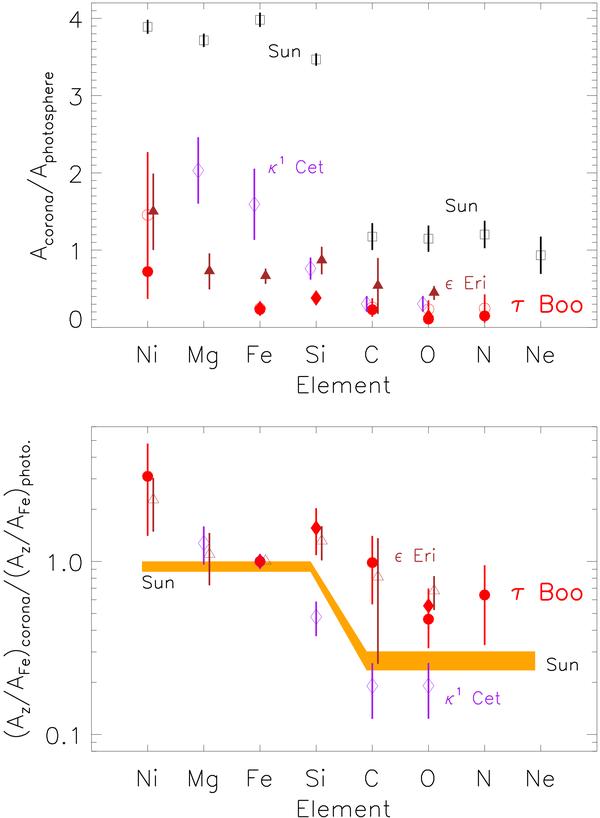
Upper: coronal to photospheric abundance ratios for the Sun (black squares), τ Boo (red circles and filled diamonds), and two other intermediate-activity stars (magenta empty diamonds for κ1 Cet and brown triangles for ϵ Eri). Elements are sorted as in Fig. 5. Lower: same plot but with all values divided by the Fe abundance in a logarithmic scale. The FIP bias in the solar corona is indicated by the shaded (orange) strip, and for τ Boo the abundances obtained with Method 2 are not shown for clarity.
Current usage metrics show cumulative count of Article Views (full-text article views including HTML views, PDF and ePub downloads, according to the available data) and Abstracts Views on Vision4Press platform.
Data correspond to usage on the plateform after 2015. The current usage metrics is available 48-96 hours after online publication and is updated daily on week days.
Initial download of the metrics may take a while.