Fig. A.1
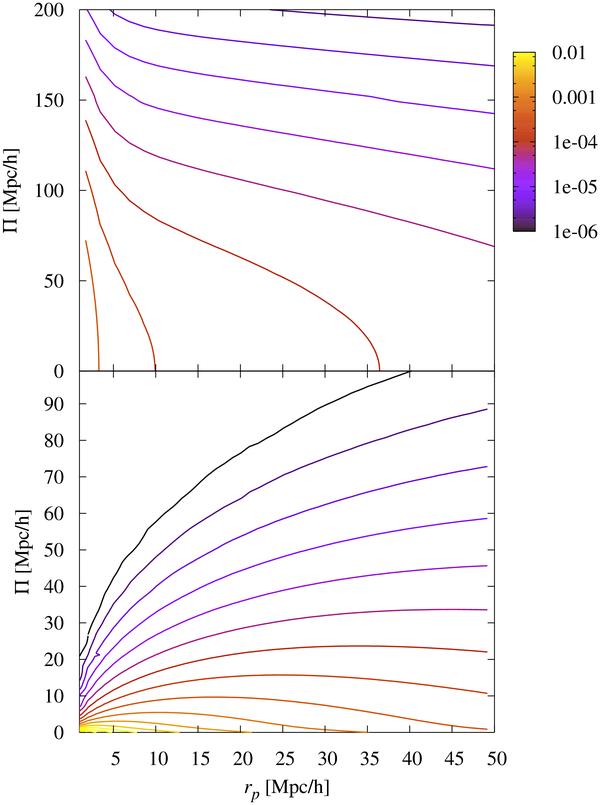
Three-dimensional gI correlation function as a function of comoving line-of-sight separation Π and comoving transverse separation rp at z ≈ 0.5. Contours are logarithmically spaced between 10-2 (yellow) and 10-6 (black) with three lines per decade. Top panel: applying a Gaussian photometric redshift scatter of width 0.02. Bottom panel: assuming exact redshifts. Note the largely different scaling of the ordinate axes. The galaxy bias has been set to unity, and (6) with SuperCOSMOS normalisation has been used to model PδI in both cases. Redshift-space distortions have not been taken into account.
Current usage metrics show cumulative count of Article Views (full-text article views including HTML views, PDF and ePub downloads, according to the available data) and Abstracts Views on Vision4Press platform.
Data correspond to usage on the plateform after 2015. The current usage metrics is available 48-96 hours after online publication and is updated daily on week days.
Initial download of the metrics may take a while.