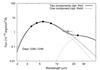
Fig. 9
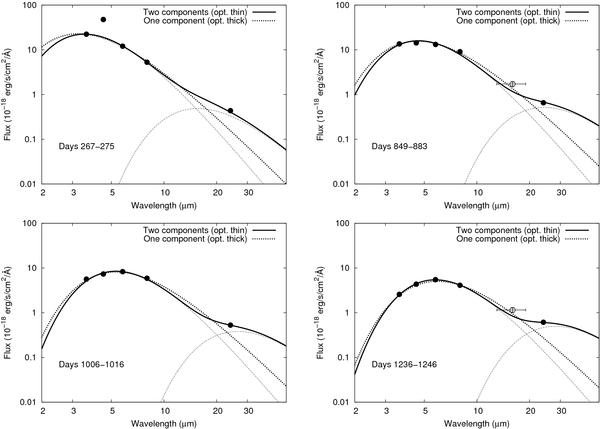
Single-component blackbodies (optically thick case, dotted lines) and two-component analytic dust models (optically thin case, solid lines) compared to the MIR SEDs. At the first epoch, we eliminated the 4.5 μm point from the fitting, because of the excess flux from the 1 − 0 vibrational band of CO (see text for details). The IRS PUI fluxes are also shown as empty circles for illustration, but those were not included in the fitting.
Current usage metrics show cumulative count of Article Views (full-text article views including HTML views, PDF and ePub downloads, according to the available data) and Abstracts Views on Vision4Press platform.
Data correspond to usage on the plateform after 2015. The current usage metrics is available 48-96 hours after online publication and is updated daily on week days.
Initial download of the metrics may take a while.