Fig. 11
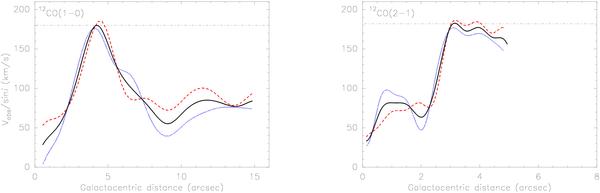
Left panel: the 12CO(1–0) RC derived as described in the text. The positive (negative) velocities, corrected for inclination, are shown as a red dashed (blue dotted) line; the black line shows the average. The horizontal dot-dashed line at 180 km s-1 indicates the velocity of the bulk of the molecular gas. Right panel: the same as the left panel, but for 12CO(2–1).
Current usage metrics show cumulative count of Article Views (full-text article views including HTML views, PDF and ePub downloads, according to the available data) and Abstracts Views on Vision4Press platform.
Data correspond to usage on the plateform after 2015. The current usage metrics is available 48-96 hours after online publication and is updated daily on week days.
Initial download of the metrics may take a while.