Fig. 12
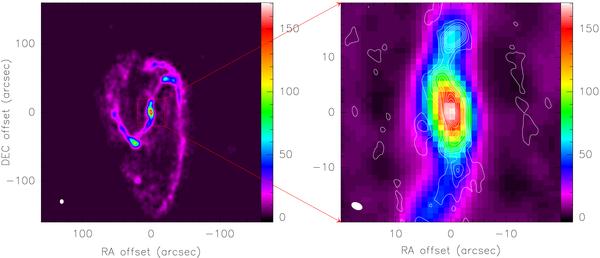
Left panel: the BIMA SONG 12CO(1–0) emission image of NGC 3627 (Regan et al. 2001). The beam of 6 6 × 55 is plotted in the lower left. The inner 320″ are shown. Right panel: NUGA 12CO(1–0) contours (in white) as in Fig. 4 (left panel) overlaid on the BIMA SONG 12CO(1–0) emission image. The 12CO(1–0) NUGA beam of 21 × 13 is plotted in the lower left. The inner 40″ are shown.
Current usage metrics show cumulative count of Article Views (full-text article views including HTML views, PDF and ePub downloads, according to the available data) and Abstracts Views on Vision4Press platform.
Data correspond to usage on the plateform after 2015. The current usage metrics is available 48-96 hours after online publication and is updated daily on week days.
Initial download of the metrics may take a while.