Fig. 25
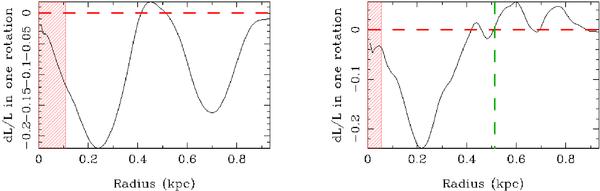
The torque, or more precisely the fraction of the angular momentum transferred from/to the gas in one rotation (dL/L), computed with the HST-NICMOS F160W image, is plotted for 12CO(1–0) (left) and 12CO(2–1) (right). The (red) dashed area corresponds to the resolution limit of our observations. In the left panel, the limiting factor is the 12CO(1–0) map resolution (~125 pc), while, on the right, the 12CO(2–1) map resolution (~59 pc). In the right panel, the (green) vertical dashed line at 0.51 kpc indicates the 12CO(2–1) FOV at the PdBI.
Current usage metrics show cumulative count of Article Views (full-text article views including HTML views, PDF and ePub downloads, according to the available data) and Abstracts Views on Vision4Press platform.
Data correspond to usage on the plateform after 2015. The current usage metrics is available 48-96 hours after online publication and is updated daily on week days.
Initial download of the metrics may take a while.