Fig. 8
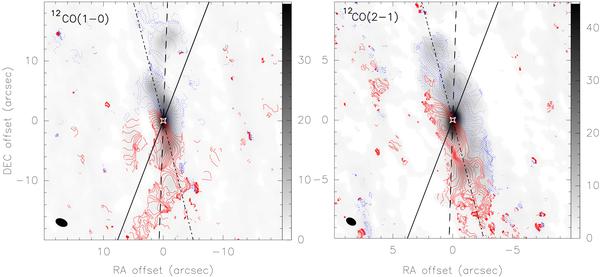
Left panel: overlay of the integrated 12CO(1–0) emission, same as Fig. 4 (left panel), with CO mean-velocity field in contours spanning the range –180 to 180 km s-1 in steps of 10 km s-1. The white star indicates the dynamical center of the galaxy. The velocities are referred to Vsys,hel = 744 km s-1, solid (red) lines are used for positive velocities, and dashed (blue) lines for negative velocities. The dashed line indicates the position angle of the major axis of the whole observed region (PA = 178° ± 1°), while the dot-dashed line traces the position angle of the major axis of the bar-like structure (PA = 14° ± 2°). The continuum line indicates the position angle of the primary stellar bar identified with the NIR H-band 2MASS image (PA = −21°) (see later the left panel of Fig. 16 and Sect. 5.2). Right panel: same for 12CO(2–1). The dashed line indicates the position angle of the major axis of the whole 12CO(1–0) observed region (PA = 178° ± 1°, see left panel), while the dot-dashed line traces the position angle of the major axis of the 12CO(2–1) bar-like structure (PA = 15° ± 2°). The continuum line indicates the position angle of the primary stellar bar identified with the NIR H-band 2MASS image (PA = −21°) (see later Fig. 16 and Sect. 5.2).
Current usage metrics show cumulative count of Article Views (full-text article views including HTML views, PDF and ePub downloads, according to the available data) and Abstracts Views on Vision4Press platform.
Data correspond to usage on the plateform after 2015. The current usage metrics is available 48-96 hours after online publication and is updated daily on week days.
Initial download of the metrics may take a while.