Fig. 2
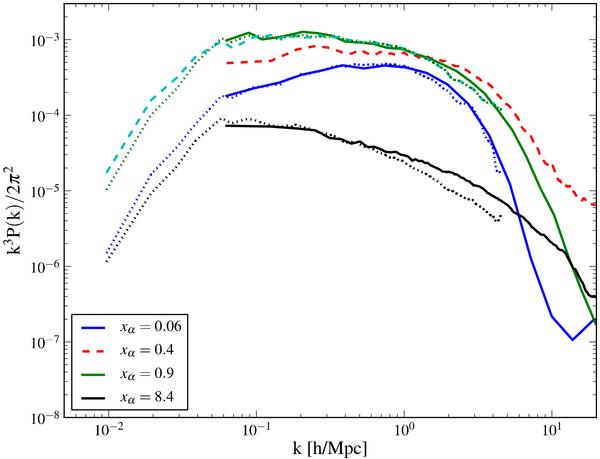
Power spectrum of
 for several values of ⟨ xα ⟩ . Dotted
lines correspond to simulation S1, solid lines to simulation S2 and the top dashed
line to simulation S3. Redshifts from top to bottom are: 19.25
(⟨ xα ⟩ = 0.9), 20.25
(⟨ xα ⟩ = 0.4), 22.5
(⟨ xα ⟩ = 0.06), 18.75
(⟨ xα ⟩ = 8.4). Again, the top,
cyan dashed line shows the correction when doing the full
calculation.
for several values of ⟨ xα ⟩ . Dotted
lines correspond to simulation S1, solid lines to simulation S2 and the top dashed
line to simulation S3. Redshifts from top to bottom are: 19.25
(⟨ xα ⟩ = 0.9), 20.25
(⟨ xα ⟩ = 0.4), 22.5
(⟨ xα ⟩ = 0.06), 18.75
(⟨ xα ⟩ = 8.4). Again, the top,
cyan dashed line shows the correction when doing the full
calculation.
Current usage metrics show cumulative count of Article Views (full-text article views including HTML views, PDF and ePub downloads, according to the available data) and Abstracts Views on Vision4Press platform.
Data correspond to usage on the plateform after 2015. The current usage metrics is available 48-96 hours after online publication and is updated daily on week days.
Initial download of the metrics may take a while.