Fig. 13
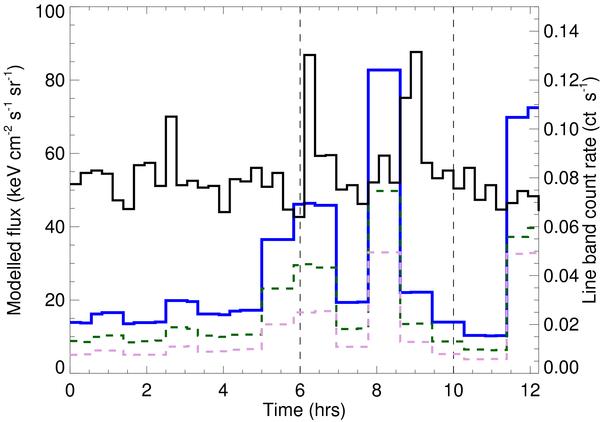
Example modelled lightcurve (blue, left-hand y-axis) with the XMM-Newton line-band (black, right-hand y-axis), for the case where the first eigenvalue percentage contribution was the lowest when comparing the modelled flux and XMM-Newton lightcurves. The contribution to the modelled lightcurve from the magnetosheath (green-dashed) and region past the bow shock (plum-dashed) are also shown. The SWCX-affected period was taken between the vertical dashed lines.
Current usage metrics show cumulative count of Article Views (full-text article views including HTML views, PDF and ePub downloads, according to the available data) and Abstracts Views on Vision4Press platform.
Data correspond to usage on the plateform after 2015. The current usage metrics is available 48-96 hours after online publication and is updated daily on week days.
Initial download of the metrics may take a while.