Free Access
Fig. 16
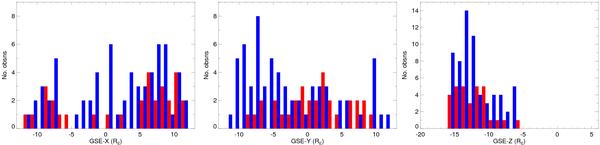
Histograms of mid-observation (left) GSE-X, (middle) GSE-Y and (right) GSE-Z XMM-Newton positions for good (blue) and bad (red) fractional differences between the observed and modelled fluxes. The histogram bins have been offset from one another in the plot, for ease of viewing.
This figure is made of several images, please see below:
Current usage metrics show cumulative count of Article Views (full-text article views including HTML views, PDF and ePub downloads, according to the available data) and Abstracts Views on Vision4Press platform.
Data correspond to usage on the plateform after 2015. The current usage metrics is available 48-96 hours after online publication and is updated daily on week days.
Initial download of the metrics may take a while.