Free Access
Fig. 4
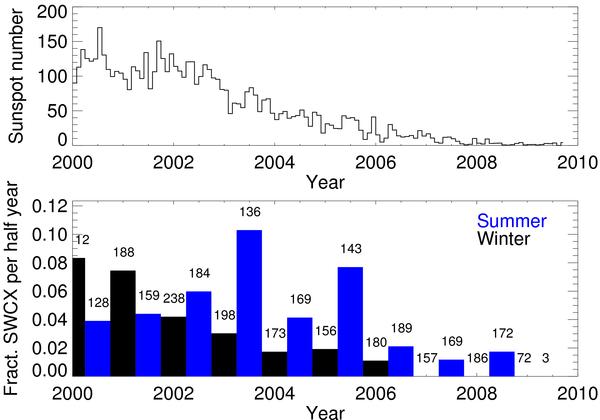
Top panel: sunspot number versus time. Bottom panel: the coloured histogram of the fraction of observations affected by exospheric SWCX is binned into six month periods (blue – summer, black – winter). The total number of all observations for each period is noted above the bin.
Current usage metrics show cumulative count of Article Views (full-text article views including HTML views, PDF and ePub downloads, according to the available data) and Abstracts Views on Vision4Press platform.
Data correspond to usage on the plateform after 2015. The current usage metrics is available 48-96 hours after online publication and is updated daily on week days.
Initial download of the metrics may take a while.