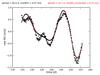
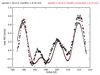
Fig. 6
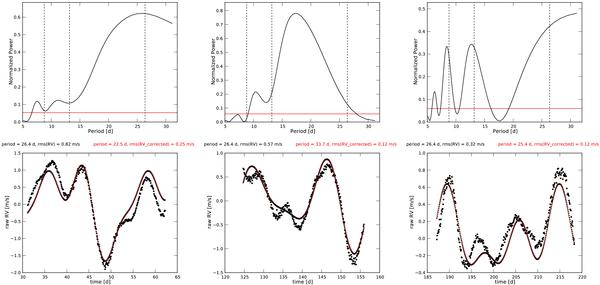
Periodograms (top) and corresponding RVs (bottom)
for three different slices of 31 days for the activity simulation shown in
Fig. 5
( ). In the
periodograms the horizontal line corresponds to the 1% false-alarm probability and
the vertical dashed lines to the rotational period of the star,
Prot, as well as
Prot/2 and
Prot/3. On the RV plots, the dots
correspond to the simulated RVs and the triangles to a fitted function with three
sin waves of period Pfit,
Pfit/2 and
Pfit/3
(Pfit is a free parameter).
Prot as well as the rms of the simulated RVs can be
found in the upper left part of the plot. Pfit as well
as the rms of the corrected RVs (simulated minus fitted sine waves) can be found in
the upper right part of the plot.
). In the
periodograms the horizontal line corresponds to the 1% false-alarm probability and
the vertical dashed lines to the rotational period of the star,
Prot, as well as
Prot/2 and
Prot/3. On the RV plots, the dots
correspond to the simulated RVs and the triangles to a fitted function with three
sin waves of period Pfit,
Pfit/2 and
Pfit/3
(Pfit is a free parameter).
Prot as well as the rms of the simulated RVs can be
found in the upper left part of the plot. Pfit as well
as the rms of the corrected RVs (simulated minus fitted sine waves) can be found in
the upper right part of the plot.

Current usage metrics show cumulative count of Article Views (full-text article views including HTML views, PDF and ePub downloads, according to the available data) and Abstracts Views on Vision4Press platform.
Data correspond to usage on the plateform after 2015. The current usage metrics is available 48-96 hours after online publication and is updated daily on week days.
Initial download of the metrics may take a while.