Fig. 8
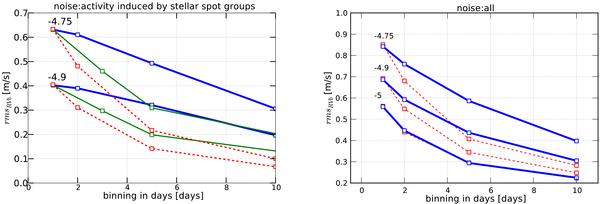
Evolution of the binned RV variation,
rmsRVb, owing to activity-related group
spots (left panel) and to all kind of stellar noises (right
panel) as a function of the binning in days. The three strategies shown for
different  (given for each lines)
use three measurements per night of 10 min and 10 nights of observation per month. The
only difference lies in the spacing between each night of observation. Thicks lines
correspond to the 3N1 strategy, thin lines to the 3N2 strategy, and dashed lines to
the 3N3 strategy.
(given for each lines)
use three measurements per night of 10 min and 10 nights of observation per month. The
only difference lies in the spacing between each night of observation. Thicks lines
correspond to the 3N1 strategy, thin lines to the 3N2 strategy, and dashed lines to
the 3N3 strategy.
Current usage metrics show cumulative count of Article Views (full-text article views including HTML views, PDF and ePub downloads, according to the available data) and Abstracts Views on Vision4Press platform.
Data correspond to usage on the plateform after 2015. The current usage metrics is available 48-96 hours after online publication and is updated daily on week days.
Initial download of the metrics may take a while.