Fig. 9
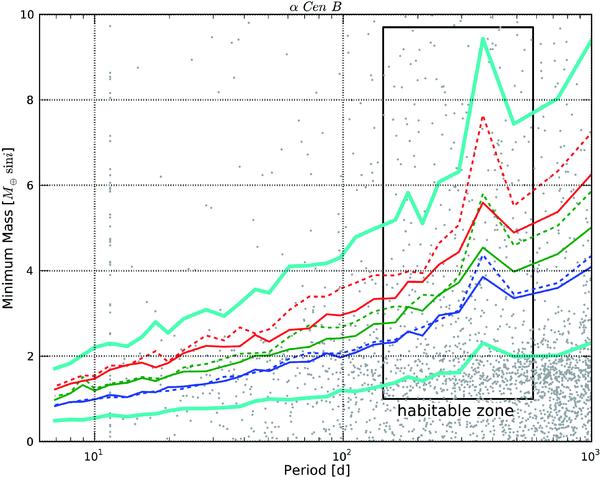
Detection limits for
α Cen B (K1V)
for different activity levels and strategies. The thick line at the top corresponds to
the present HARPS observational strategy (one measurement per night of 15 min, 10
consecutive days each month) for an activity level
 . The second thick line
at the very bottom corresponds to the detection limit, using ESPRESSO, for the 3N3
strategy and an activity level
. The second thick line
at the very bottom corresponds to the detection limit, using ESPRESSO, for the 3N3
strategy and an activity level  . Besides these two thick
lines, from top to bottom, the dashed thin lines correspond to the 3N1 strategy using
HARPS, for an activity level , − 4.9 and − 5,
respectively. The 3N3 strategy using HARPS corresponds to the continuous thin lines on
the same order of activity level. Finally, the small dots represent the planets
expected from Bern’s model with a random sini for each body. We see
that the cut-off in period around 12 days of the model introduces an anomaly in the
planet distribution. The habitable zone is derived using the model of Selsis et al. (2007) applied to the temperature and
the luminosity of a K1V dwarf, calculated using the results of de Jager & Nieuwenhuijzen (1987).
. Besides these two thick
lines, from top to bottom, the dashed thin lines correspond to the 3N1 strategy using
HARPS, for an activity level , − 4.9 and − 5,
respectively. The 3N3 strategy using HARPS corresponds to the continuous thin lines on
the same order of activity level. Finally, the small dots represent the planets
expected from Bern’s model with a random sini for each body. We see
that the cut-off in period around 12 days of the model introduces an anomaly in the
planet distribution. The habitable zone is derived using the model of Selsis et al. (2007) applied to the temperature and
the luminosity of a K1V dwarf, calculated using the results of de Jager & Nieuwenhuijzen (1987).
Current usage metrics show cumulative count of Article Views (full-text article views including HTML views, PDF and ePub downloads, according to the available data) and Abstracts Views on Vision4Press platform.
Data correspond to usage on the plateform after 2015. The current usage metrics is available 48-96 hours after online publication and is updated daily on week days.
Initial download of the metrics may take a while.